The most common question I get from my customers who are using Configuration Manager is without a doubt; “Can I get a report on this?”, “Is there a dashboard for this?” or other analytics.
Well, as most of you know, the reports straight out of System Center Configuration Manager isn’t always the best and there is no simple way of creating a dashboard either, at least not for the customer to use directly.
In this post I will be working with Analytics Plus from ManageEngine and show you how you can read data from the database directly and create a dashboard with three of the most common requests.
Background
Analytics Plus integrates out of the box with other solutions from ManageEngine, ServiceDesk Plus and OpManager for example, but you also have the possibility to fetch data from other sources like MySQL, SQL and Oracle databases.
Get Analytics Plus
Analytics Plus is available in a 30-day trial and can be downloaded from the following link:
https://www.manageengine.com/analytics-plus/download.html
My environment
I will be using my small environment for this which consists of:
- Int-DC01
- Domain controller and hosts Analytics Plus
- Int-CM01
- Primary Configuration Manager site
- Client01
- Windows 10 client installed and managed with Int-CM01
Installation
The installation of Analytics Plus is as easy as clicking “Next” a few times and waiting for the installation to complete. One thing you need to take a note of is the port-numbers that will be used to access the webpage that hosts the interface. Standard ports are:
- 8443
- 8200
Once the installation is completed, verify that the services are running:

Configuration
Since we will be working with the System Center Configuration Manager database we need to create a local SQL service account that will be used to read data from the SQL-server. This account should only have read access to the database, called CM_<SiteCode>. (In my case CM_P01)
Once this account has been created, connect to the server hosting Analytics Plus and open a web browser. Then go to the following link: “https://localhost:8443”
Note that it’s https and not http, also change the port if required.
You should see the following page:

As you can see, the default username and password is “admin”
Connect to a database
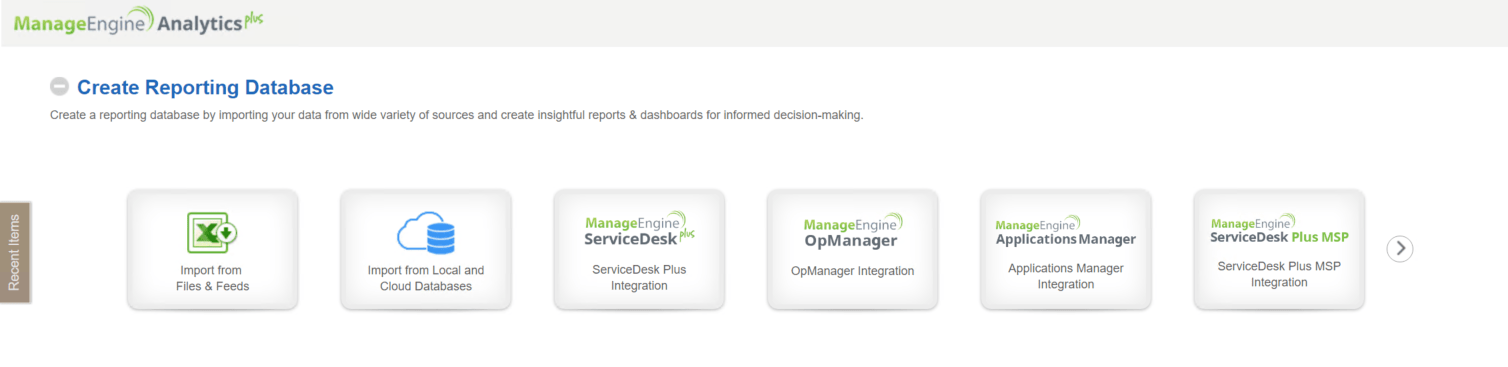
Once you have logged in to Analytics Plus you are presented with a few options on how to create a reporting database. As you can see, there are a few preconfigured options for other products from ManageEngine. But we will fetch data from our own database, so click on “Import from Local and Cloud Databases”
This will open a wizard that will guide you through the entire process. I’ve entered the data required in the following pictures, just change the values to match your environment.

On the next page you have the option to either select a single table to import, or to write your own custom query. Here you can choose what you would like to do. Further down I will show you how to import new data with a query, so in this case I will select the first available table.
When selected, in this case table _394_CONTROLLER_DATA, you are able to give the table a new name that will be used in Analytics Plus and to select which columns to import. When done, click on “Create”

Once imported, you will see a summary of the import, and you will be able to set a scheduled on how often you would like to do this import. Depending on the data you want, the time is different, but I set the import to once every day.
When done, click on close.

Once you’ve clicked on close you will get a question if Analytics Plus should analyze and create reports for you. I’ve tried this on a few tables but unfortunately this doesn’t work all to well on the database for Configuration Manager, so I would recommend that you click on “No” at this time.
Then you will be presented with the table, in my case it will be empty since I don’t use this table in my environment.

Import data and create a new report
Okay, now that we have everything in place and know how to import data from our database, it’s time to create our first report that will actually show something useful.
Almost every head of IT or similar would like to know how many clients there are in the environment and what OS they are running, they don’t need to know the name of client or it’s location, just a number.
So the first report we will create will contain the above information in nice chart view.
The first thing we need to do is to find in which table in our database we can find the information we need. If we examine the database for our System Center Configuration Manager, we can select the top 1000 items from the table called “dbo.Operating_System_DATA”

Top 1000 results from dbo.Operating_System_DATA
As you can see, we have the name of the OS under “Caption00”, so we will use this table for this report.
Back in Analytics Plus we then click on “Import Data” in the upper right-hand corner.
We then select to import data from “Local and Cloud Databases”, which will bring up the same guide as before. Enter the details and click on “Next”.
On the next page, select to import data from a single table and select “Operating_System_DATA”. Then click on “Next”.
For this scenario we will only need the data under “Caption00”, but for further use, I will select the following columns:
- MachineID
- BuildNumber00
- Caption00 OR Name00
- OSLanguage00
When done selecting your columns, give the table a name that will shown in Analytics Plus and then click “Create”. When done you should be redirected to the following view:

Click on “Schedule This Import” and choose how often new data should be imported, I choose to do this once every day. Then click on close to view the table:

The next step is to create our first chart view. To do this, click on the “Add-button”, just above “Edit Design” and select “New Chart View”.
One thing that I like about Analytics Plus is that creating reports and charts is really easy, all we need to do now, is to drag “Caption00” from the left pane over to the box for “X-Axis” and change to a “Bar graph” instead of a “Pie chart”. The result should be similar to the following depending on the data in your table:

When done, save the the chart and give it a name, Operating Systems for example.
Next, let us create another “Bar Chart”, so following the instructions above for Operating System, create one using the table called “EP_Malware” and when creating the chart, set ThreatName on the “X-Axis”.
Depending on your data, the chart will look similar to the following (I’ve infected my client with EICAR):

Outbreak of EICAR
Import data with query and create a report
Well, the above is pretty nice, but still it’s just numbers. Another report that could be nice is to check the status of content that is being distributed to our distribution points.
Checking this in the console is possible, but it still requires several clicks and you need to check every package and application one by one, so in this example we will create a “Pie chart” that contains all of the information we need for a quick overview.
This however requires the we write our own query since we will be needing information from several different tables and views.
I will post the complete query here, but not going in to details on every part.
(When copying the code, choose to view the source for correct formatting)
SELECT     v_Package.Name AS Package_Name,
		   SMS_DistributionDPStatus.PackageID,
		   'Package Type (Text)' =
				Case
					when v_Package.PackageType = 0 Then 'Software Distribution Package'
					when v_Package.PackageType = 3 Then 'Driver Package'
					when v_Package.PackageType = 4 Then 'Task Sequence Package'
					when v_Package.PackageType = 5 Then 'Software Update Package'
					when v_Package.PackageType = 6 Then 'Device Setting Package'
					when v_Package.PackageType = 7 Then 'Virtual Package'
					when v_Package.PackageType = 8 Then 'Application'
					when v_Package.PackageType = 257 Then 'Image Package'
					when v_Package.PackageType = 258 Then 'Boot Image Package'
					when v_Package.PackageType = 259 Then 'Operating System Install Package'
				Else
					'Unknown'
				End,
		   SMS_DistributionDPStatus.Name AS DP_Name,
		   CASE
			    WHEN MessageState = 1 THEN 'Success'
				WHEN MessageState = 2 THEN 'In Progress'
				WHEN MessageState = 4 THEN 'Error'
			Else
				'Unknown'
			End as 'Content_Status',
           CASE
				WHEN MessageCategory = 31 THEN 'Success'
				WHEN MessageCategory = 76 THEN 'In Progress'
				WHEN MessageCategory = 13 THEN 'Failed to distribute content'
				WHEN MessageCategory = 70 THEN 'Failed to update package'
				WHEN MessageCategory = 78 THEN 'Failed to connect to remote distribution point'
				WHEN MessageCategory = 51 THEN 'Content transfer manager was instructed to send content to the distribution point'
				WHEN MessageCategory = 37 THEN 'Content transfer manager was instructed to send content to the distribution point'
				WHEN MessageCategory = 1  THEN 'Waiting for prestage content'
				WHEN MessageCategory = 77 THEN 'Waiting for prestage content'
				WHEN MessageCategory = 62 THEN 'Content hash has been sucessfully verified'
				WHEN MessageCategory = 7  THEN 'The source folder for content does not exist'
				WHEN MessageCategory = 72 THEN 'Content is being redistributed to distribution point'
				WHEN MessageCategory = 4 THEN 'Content was successfully refreshed'
				WHEN MessageCategory = 998 THEN 'Content transfer manager was instructed to send content to the distribution point'
				WHEN MessageCategory = 165 THEN 'Content was distributed to distribution point'
				WHEN MessageCategory = 61 THEN 'Failed to validate content hash'
				WHEN MessageCategory = 24 THEN 'Failed to connect to distribution point'
				ELSE 'Unknown'
		   END
		   AS 'Detailed_Status',
		   SMS_DistributionDPStatus.MessageState,
		   SMS_DistributionDPStatus.MessageCategory,
           SMS_DistributionDPStatus.ObjectTypeID,
           SMS_DistributionDPStatus.LastUpdateDate,
           SMS_DistributionDPStatus.InsString3,
           v_Package.PkgSourcePath,
           v_Package.PackageType
FROM         vSMS_DistributionDPStatus AS SMS_DistributionDPStatus INNER JOIN
                      v_Package ON SMS_DistributionDPStatus.PackageID = v_Package.PackageID
           order by SMS_DistributionDPStatus.PackageID
So, to import the data, do as before. But instead of selecting a single table, click on “Custom Query” and paste the query in the box and click on “Next”. You should be presented with a similar result depending on your data:

Give the table a name that will be used in Analytics Plus and then click on “Create”.
Then select how often new data should be fetched, in this case I would recommend every other hour.
With the table open, choose to create a new chart view and add “Content_Status” to the “X-Axis”. This will generate a pie chart based on the status and the result will be the following, depending on your data and statuses;

Save the chart by giving it a name and the go back to the tab called Explorer.
Creating a Dashboard
So, now we have three charts but handing this to the head of IT might not be the best idea, so we will create a dashboard that contains all of them.
To do this, simply click on “New” and select “New Dashboard”

In the new view, simply drag the charts we created over to the right and position them in a way that you like, the result should be similar to this:

Then save the dashboard and give it a suitable name, for example “Quick Overview”.
To see the new dashboard in action, click on “View Mode”. From here you can drill down to the data that the charts are based on for more information.
Bonus
So, we have a nice dashboard with the information that updates every hour or day depending on what you’ve configured it to do. But how will we present it to the receiving person?
Well, you can either export it to a PDF or HTML file, send it directly in a mail, or even better, publish a permalink that will auto refresh.
To do this, simply click on “Publish” in the top-right corner and select “URL / Permalink for this view”. From here you can define auto refresh and what to include.

Conclusion
Creating reports and dashboards has never been as easy as with Analytics Plus. It still requires that you have basic knowledge in SQL and a good understanding of how the database for Configuration Manager is built, but a lot of the headache is removed when trying to create a dashboard in System Center Configuration Manager.
What happens now?
I will continue to develop guides for new reports and post them on my site for you to use, I have a few in mind, but if there is something specific that you would like to see, let me know and I will try to create it!
More reports can be found HERE!